ChartGPT is an innovative AI tool designed to simplify data visualization. With its user-friendly interface, users can effortlessly create stunning charts and graphs tailored to their specific needs. Whether you're a business analyst, educator, or researcher, ChartGPT empowers you to transform complex data into clear, visual insights. Explore the various features that make data visualization accessible and engaging for everyone, and discover how ChartGPT can enhance your data storytelling.
ChartGPT
Features of ChartGPT
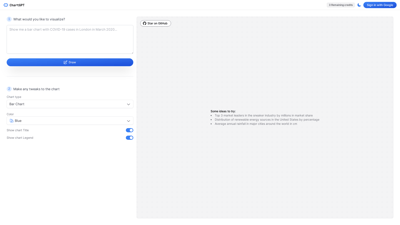
1. User-Friendly Interface
ChartGPT boasts an intuitive interface that allows users to create visualizations without any prior design experience. The drag-and-drop functionality ensures that anyone can produce professional-quality charts in minutes.
2. Diverse Chart Types
With ChartGPT, users can choose from a wide variety of chart types, including bar charts, line graphs, pie charts, and more. This versatility enables users to select the most effective visualization for their data.
3. Customization Options
Users can make tweaks to their charts, adjusting colors, titles, and legends to fit their branding or presentation style. This feature ensures that every chart is unique and tailored to the user's preferences.
4. Data Import Capabilities
ChartGPT allows users to import data from various sources, including CSV files and spreadsheets. This feature streamlines the process of getting data into the platform, making it easier to visualize existing datasets.
5. Collaboration Tools
The platform supports collaboration, enabling teams to work together on visualizations in real-time. This is particularly useful for businesses and educational institutions that require input from multiple stakeholders.
6. Export Options
Once a chart is created, users can easily export their visualizations in multiple formats, including PNG, JPEG, and PDF. This feature is essential for sharing insights in reports or presentations.
7. GitHub Integration
ChartGPT offers seamless integration with GitHub, allowing users to share their visualizations with the developer community and receive feedback or contributions.
ChartGPT FAQs
What is ChartGPT?
ChartGPT is an AI-powered tool designed to help users create stunning data visualizations effortlessly. It caters to various users, including business analysts, educators, and researchers.
How do I create a chart?
To create a chart, simply choose the type of visualization you want, input your data, and customize it using the available options. The user-friendly interface makes this process straightforward.
Can I import data from other sources?
Yes, ChartGPT allows users to import data from CSV files and spreadsheets, making it easy to visualize existing datasets without manual entry.
Is there a collaboration feature?
Absolutely! ChartGPT supports real-time collaboration, allowing multiple users to work on visualizations simultaneously, which is perfect for teams.
What formats can I export my charts in?
Users can export their charts in various formats, including PNG, JPEG, and PDF, making it easy to share insights in reports and presentations.
Search 10000+ Useful AI Tools By What You Need.
Copyright © 2025 AListForAi All rights reserved